Article begins
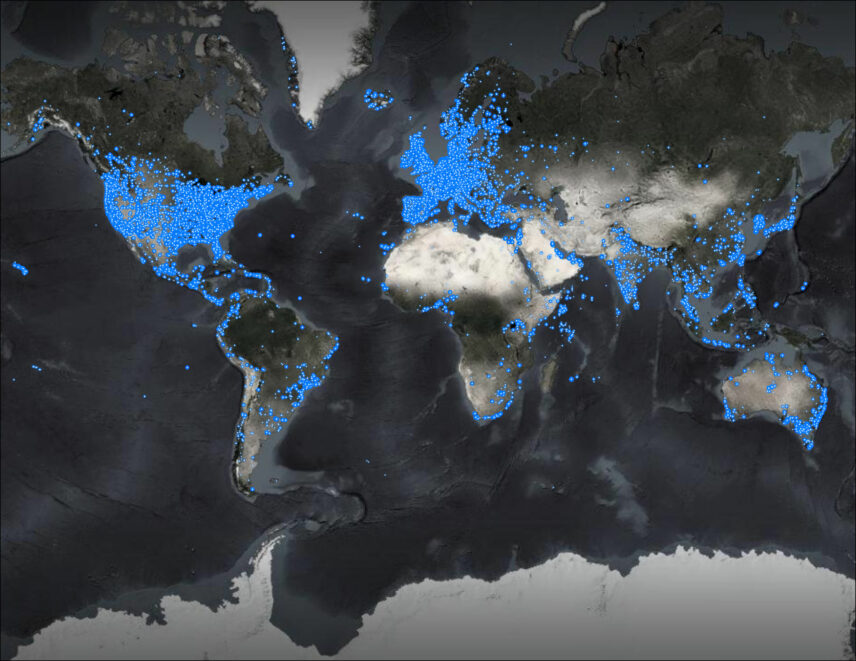
Litter is an artifact, like a ceramic sherd, wrought iron nail, or lithic debitage that has leaked or escaped or otherwise been thrown out. It is a discard—a plastic bottle, cigarette butt, or face mask―that shapes and is shaped by our attitudes towards convenience, sustainability, the environment, and each other. Over the last eight years the environmental technology startup Litterati has amassed a database of over 16 million litter data records—litter found in public spaces around the globe. Each record of litter in places such as beaches, parks, shopping centers, and residential areas contains a digital photograph of one or more pieces of litter, a set of geotagged coordinates (longitude and latitude), and a timestamp. How can the analysis of litter data help cities and organizations to develop strategies for understanding, managing, and ultimately reducing litter?
Litter data points
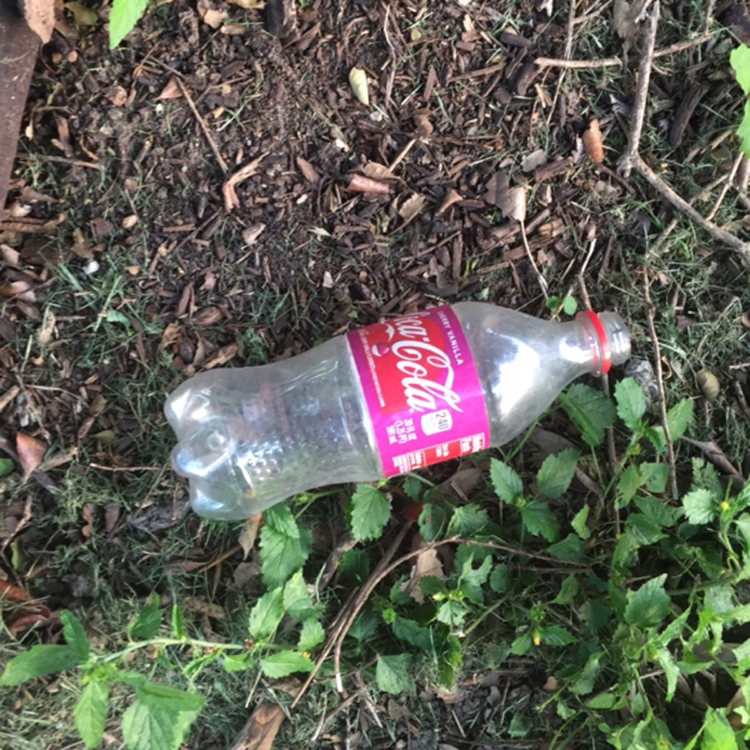
Like other forms of waste, rubbish, trash, or detritus, litter often defies classification and ordering. A great deal of resources are required to reorder litter into something intelligible, measurable, and actionable. Litter data is a digital reference that indexes litter into a structured catalog of information. The work of documenting litter, transforming it into litter data, and extracting meaning from litter data is done using a combination of citizen science, machine learning, and geospatial analyses. When a piece of litter is recorded in the Litterati application, the app user will be given an opportunity to tag that image along four axes: category, object, material, and brand. These tags are used to help our data science team train LitterAI, an image classification model used to predict and classify images of litter. Subsequently, LitterAI enables us to classify images of litter even if a user did not take the opportunity to tag it themselves. For example, one of our researchers identified a piece of litter which was then labeled by LitterAI using the axes above as a Coca-Cola (brand), plastic (material), and bottle (object) in the drink category.

This bottle, in figure 2, was one litter data point in my first assignment at Litterati―the TrashBlitz project in Austin, Texas. TrashBlitz Austin is a community-based research collaboration between the 5 Gyres Institute, Into the Sea, Inland Ocean Coalition, and Litterati, focusing on the assessment of single-use plastic items across a diverse and representative set of sociodemographic areas throughout the city. Research volunteers found 6,656 pieces of litter across a representative set of sampling locations distributed across census tracts in Austin. To make sense of this data, I mapped concentrations of litter on top of a variety of spatial and demographic datasets from the American Community Survey (e.g., average median income), the Center for Disease Control and Prevention (e.g., smoking prevalence), and local data from the City of Austin (e.g., land use and watershed data). This process of mapping and discovery is called exploratory spatial data analysis (ESDA). Over the next six weeks, our teams had several discussions about what the analysis meant and how best to visualize and tell the story about litter data in Austin.
One topic of discussion focused on defining what the TrashBlitz team meant by the phrase single-use plastics followed by which pieces of litter recorded by the volunteers are recyclable. The Coca-Cola bottle in figure 2 is made of polyethylene terephthalate (PET) plastic, designed to be thrown away once consumed, and recyclable. While plastic bottles are commonly known to be recyclable, it is also common for municipalities with single-stream recycling systems to be unable to process plastic bags, including trash bags and grocery bags. Depending on the audience, we may not want to classify plastic grocery bags and other soft plastics as recyclable within a specific municipality, even if it is possible that some local grocery stores may accept clean and dry plastic bags for private recycling. Lastly, we ran into one more issue, the identification of littered plastics by resin identification codes (RICS), the number often found on the bottom of plastic consumer goods. The TrashBlitz team asked if it was possible for LitterAI to systematically categorize types of plastic by RICs. In general, the object-type of most plastic litter found by our researchers is classified as an unknown piece of plastic. Given the degraded quality of these plastics, it is exceedingly difficult for an image classification model to accurately identify the resin type for these unidentified pieces. As we finalized the TrashBlitz Austin report, our teams narrowed our focus from all single-use plastics to single-use food and drink items (e.g., bottles, wrappers, straws, and utensils).

Exploring crowdsourced litter data
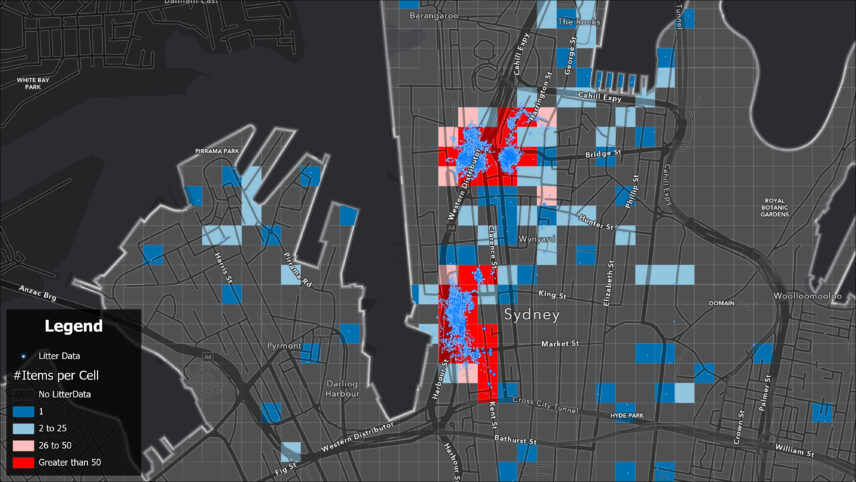
A significant amount of litter data comes from a blend of general app users and folks participating in a series of challenges organized by municipal governments, nongovernmental organizations, corporations, and researchers. While this data is numerous, exploratory spatial data analysis reveals that the places people choose to record litter are incomplete and biased by the individual. For example, our researchers have recorded over 20,000 pieces of litter in Sydney, Australia. But where are these pieces recorded? And how can we look at the data differently to better understand how representative this dataset is of Sydney? A high concentration of litter data was recorded along the eastern side of Darling Harbour. The map in figure 3 shows litter data by longitude and latitude as a blue dot and counts the pieces of litter in each 100 meter by 100 meter grid cell. By calculating how many of these grid cells have at least one piece of litter or more within them, we are able to determine the litter data coverage of Sydney is 10.72 percent. Litter data coverage is defined as the relative area of streets, sidewalks, and surfaces that Litterati app users have examined compared to the total area where someone may expect to find litter within the local government area of Sydney. For example, we would not categorize misplaced trash or rubbish inside a large commercial building as litter. The grid cell corresponding to this area would therefore not be included in the total possible area of Sydney where one may find and record litter. Mapping litter data coverage helps Litterati to know where our app users have already collected data and provides cities and other organizations partnering with Litterati the ability to strategize and coordinate with cleanup volunteers or solid waste employees to target the areas where their services are most needed. One major limitation of crowdsourced data, however, is the ability to determine if one area is statistically more likely to have litter than another. If you work for a parks and recreation department, how can litter data help you to prioritize a litter reduction campaign in one part of the city versus another? Without the ability to make these comparisons, cities and organizations are often limited in their ability to develop comprehensive strategies for managing litter.
From litter data to city fingerprint
The City Fingerprint Project (CFP), a mixed-methods study of urban litter data, juxtaposes spatial data science, machine learning, and ethnography. Three cities―Hayward, California; Memphis, Tennessee; and Norfolk, Virginia―were selected to ensure the project covered a variety of regions of the United States. The CFP has three objectives: to provide a representative baseline on litter density and composition within each city; to develop a comprehensive protocol for identifying litter hotspots and changes in the amount and composition of litter over time; and to leverage insights generated from the analysis of litter data over time to design and evaluate litter prevention strategies.
In each city, Litterati is partnering with citizen researchers trained using a rigorous sampling protocol to systematically record litter, litter hotspots, and waste infrastructure at up to 300 spatially balanced research locations at four intervals in the spring, summer, autumn, and winter of 2022. Spatially Balanced Sampling (SBS) is a probability-based sampling method that maximizes spatial independence among sample locations and should be used when the spatial pattern of the response variable is unknown prior to sampling. This approach allows us to limit our assumptions regarding the relationship between litter hotspots and other external factors while maximizing the probability that we will sample a significant variety of scenarios. For example, we may suspect that there is a relationship between the number of bars and nightclubs in a neighborhood with the amount of cigarette butt litter on the ground. However, the CFP is not exclusively focused on proving this to be true and must also account for a range of other possibilities by increasing the chance that we will cover a varied enough portion of the city to generate a slew of other hypotheses which could then be explored at a later date.

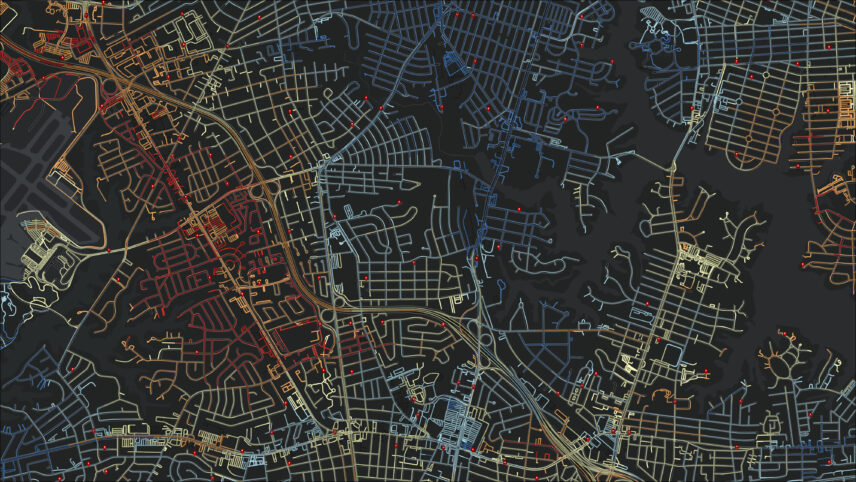
After the litter data is collected during each sampling interval, it will be processed by LitterAI, uploaded to an online geographic information system (GIS), and analyzed. For example, we will be extrapolating the relationship between the amount of litter per meter and dependent variables, yet to be determined. The map in figure 4 is a visual demonstration based on random values showing an extrapolation of the estimated litter per meter along each street or sidewalk in the study area. Being able to identify areas where the likelihood of littering is high (red) or low (blue) will help cities to better allocate resources to the abatement of existing litter. And yet, how do we decide which dependent variables to test and ultimately use in our extrapolation models?
Towards the start of the CFP, I conducted a series of semi-structured interviews with about 20 city-affiliated staff and volunteers. One of the topics involved discussing where staff and volunteers thought we would find more litter and some possible explanations for why they suspect litter is more concentrated in some areas than others. It was repeatedly suggested that we will likely find litter near busy intersections with fast-food restaurants and convenience stores, multi-unit apartment dwellings, and by railway yards and city-owned vacant lots. When possible, I inquired about what types of data may help me to better understand litter in each city. In addition to acquiring point of interest data on restaurants, grocery stores, and other businesses associated with the sale of consumer products that may go on to become litter, it was suggested to me that I acquire data to assess the rate of tenant turnover. Again, rather than assuming we know where the litter is and why it is there in advance, we adopted spatially balanced sampling and ethnographic methods to keep ourselves methodologically open to different scenarios.

How will City Fingerprints be used by the different cities to design litter prevention strategies? Whereas most interviewees conveyed that the identification of litter hotspots would enable them to better allocate resources for responding to litter, one interviewee focused on how litter data could help their city to become more proactive about preventing litter: “I think we’re reactive a lot of times with litter in the city and the CFP will allow us to be a little more proactive and have some science or something to back it up other than, you know, we think this CVS corner was much cleaner after this and we think it was because of this. You know, it’s a lot of ‘we thinks’ and we’re not always the, I think we’re too close to the subject matter.” Understanding and being able to demonstrate why and when litter accumulates on a particular city corner may support city-wide policies encouraging restaurants to use compostable containers and cutlery or banning plastic straws.
Today, litter is frequently encountered in urban settings across the globe. Writing about waste in 1984, the trailblazing garbologist William Rathje argued, “In the three or so million years of humankind, we have never had more reason than we have today to try to understand our relation to our artifacts―what we manufacture, use, and discard―and how our artifacts both mirror and shape our actions and attitudes.” Our relation to litter also mirrors and shapes our actions and attitudes in the domains of socioenvironmental justice, waste management, urban planning, and more. The Litterati app modifies this relation between humans, litter, and the world around us by helping us to understand where litter accumulates, thus enabling cities and organizations to react. The City Fingerprint Project, and other studies like it, help us to triangulate an understanding of why, where, and when litter accumulates, enabling decision makers in policy, industry, and the public to collaborate on litter prevention and reduction strategies.

